Measuring quality-completions of submission.
EPAS
Report generated on
2020-04-26 23:48:45
Abstract
Completion of a CV is estimated. The percentage of completion is measured as well as the insertion of info in key fields. The 10% of worst “performing” CV is discarded to improve precision.sourceTimeNeeded <- c(0);
source.starting.time <- proc.time()[3]Environment
R version
R.Version()$version.string ## [1] "R version 3.4.4 (2018-03-15)"Libraries intialisation
librariesVersion <- c()

for(i in 1:length(libraries))
    librariesVersion <- c(librariesVersion, paste(packageVersion(libraries[i] )))

librariesLoaded <- lapply(libraries, require, character.only = TRUE)
## Loading required package: magrittr## Loading required package: DT## Loading required package: ggplot2## Loading required package: jsonlite## Loading required package: methods## Loading required package: parallel## Loading required package: lubridate##
## Attaching package: 'lubridate'## The following objects are masked from 'package:data.table':
##
## hour, isoweek, mday, minute, month, quarter, second, wday, week,
## yday, year## The following object is masked from 'package:base':
##
## datetimeNeeded <- (proc.time()[3] - source.starting.time);../000.core/00.01.libraries.R completed in 1.21 seconds
sourceTimeNeeded <- c( sourceTimeNeeded, timeNeeded)


source.starting.time <- proc.time()[3]


## Base functions

# @authors kp@eworx.gr ako@eworx.gr
repository <- "/data/generic/"

getSourcePath <- function(filename, baseFolder = repository){
    return(paste(baseFolder, filename, sep = ""))
}

readData <- function(filename, colClasses = c(), baseFolder = repository, header = TRUE, sep = "\t", encoding = "UTF-8", stringsAsFactors = TRUE, na.strings = c("", "NULL"), verbose = FALSE){
    if(length(colClasses) == 0)
        return (data.table::fread(input = getSourcePath(filename, baseFolder), header = header, sep = sep, encoding = encoding, stringsAsFactors = stringsAsFactors, verbose = verbose, showProgress = TRUE, na.strings = na.strings ) )
    return (data.table::fread(input = getSourcePath(filename, baseFolder), colClasses = colClasses, header = header, sep = sep, encoding = encoding, verbose = verbose, showProgress = TRUE,   na.strings = na.strings )  )
}

#rds for small disk space & fst for fast load
saveBinary <- function(data, filename = filename, baseFolder = repository, format = "rds"){
  if(format == "rds"){saveRDS(data, getSourcePath(filename, baseFolder))}
  if(format == "fst"){fst::write_fst(data, getSourcePath(filename, baseFolder))}
}

#rds for small disk space & fst for fast load
loadBinary <- function(filename, baseFolder = repository, format = "rds", as.data.table = TRUE){
  if(format == "rds"){return(readRDS(getSourcePath(filename, baseFolder)))}
  if(format == "fst"){return(fst::read_fst(getSourcePath(filename, baseFolder), as.data.table = as.data.table))}
}

rowColumns <- function(data){
    return(paste( format(nrow(data),  big.mark=","), "Rows X ", ncol(data), "Columns"))
}

publishIncludeCss <- function(){
    sourceFile <- "/data/jobs/wp41.analysis/000.core/include.css"
    destinatinoFile <- "/data/tmpfs/results/include.css"
    if (!file.exists(destinatinoFile)) {
        return (file.copy(sourceFile, destinatinoFile))
    }else{
        return(TRUE);
    }

}
#as the mountstorage is on memory make sure the asset include.css is there.

summariseTable <- function(data){
    return(data.frame(unclass(summary(data)), check.names = FALSE, stringsAsFactors = FALSE))
    #return(do.call(cbind, lapply(data, summary)))
}

factoriseCharacterColumns <- function(data){
    for(name in names(data)){
        if( class(data[[name]]) =="character"){
            data[[name]] <- as.factor(data[[name]])
        }
    }
    return(data)
}

############################
# https://rstudio.github.io/DT/010-style.html
#https://rpubs.com/marschmi/RMarkdown

capitalise <- function(x) paste0(toupper(substring(x, 1, 1)), substring(x, 2, nchar(x)))


styliseDTNumericalColumn <- function(data, result, columnName, color, columnsName_original ){

    if(columnName%in% columnsName_original){
        result <- result %>%   formatStyle(
            columnName,
            background = styleColorBar(data[[columnName]], color),
            backgroundSize = '100% 90%',
            backgroundRepeat = 'no-repeat',
            backgroundPosition = 'center'
        )
    }
    return(result)

}


reportTabularData <- function(data){

    columnsName <- names(data)
    #columnsName <- lapply(columnsName, capitalise)
    columnsName_original <- names(data)

    result <-
        DT::datatable(
            data,
            class = 'cell-border stripe',
            filter = 'top',
            rownames = FALSE,
            colnames = columnsName,
            extensions = 'Buttons',
            options = list(
                pageLength = 20,
                columnDefs = list(list(className = 'dt-left', targets = "_all")),
                dom = 'Bfrtip',
                buttons = c('copy', 'csv', 'excel', 'pdf'),
                searchHighlight = TRUE,
                initComplete = JS(
                    "function(settings, json) {",
                        "$(this.api().table().header()).css({'border': '1px solid'});",
                    "}"
                )
            )

        )


    result <- styliseDTNumericalColumn(data,result, "Count", 'steelblue', columnsName_original)
    result <- styliseDTNumericalColumn(data,result, "sourceTimeNeeded", '#808080', columnsName_original)
    result <- styliseDTNumericalColumn(data,result, "timeNeeded", '#808080', columnsName_original)
    result <- styliseDTNumericalColumn(data,result, "percentMatch", '#4682b4', columnsName_original)

    return(result)
}

fonts <- list(
 sans = "DejaVu Serif",
  mono = "DejaVu Serif",
  `Times New Roman` = "DejaVu Serif"
)

cleanJsonId <- function(txt){
    txt <- gsub("\\.json", "", txt)
    gsub(".*/", "", txt)
}

embed_data <- function(x= mtcars, filename= "file.csv", label= "Get data"){

  # Create encoded Base64 datastream
  encode_data= function(x){
    saveMe <- getSourcePath("file.csv")
    write.csv2(x, saveMe)
    enc= sprintf('data:text/csv;base64,%s', openssl::base64_encode(paste0(readLines(saveMe), collapse="\n")) )
    unlink(saveMe)
    return(enc)
  }

  # String result ready to be placed in rmarkdown
  paste0("<a download='", filename, "' href=", encode_data(x), ">", label, "</a>")

}

###########################################################################################################
Libraries version
if(exists("libraries")){
    data.table(library = libraries, version = librariesVersion)
}
includeCssPublished <- publishIncludeCss()Session info
sessionInfo()## R version 3.4.4 (2018-03-15)
## Platform: x86_64-pc-linux-gnu (64-bit)
## Running under: Ubuntu 16.04.6 LTS
##
## Matrix products: default
## BLAS: /usr/lib/libblas/libblas.so.3.6.0
## LAPACK: /usr/lib/lapack/liblapack.so.3.6.0
##
## locale:
## [1] LC_CTYPE=en_US.UTF-8 LC_NUMERIC=C
## [3] LC_TIME=en_US.UTF-8 LC_COLLATE=en_US.UTF-8
## [5] LC_MONETARY=en_US.UTF-8 LC_MESSAGES=en_US.UTF-8
## [7] LC_PAPER=en_US.UTF-8 LC_NAME=C
## [9] LC_ADDRESS=C LC_TELEPHONE=C
## [11] LC_MEASUREMENT=en_US.UTF-8 LC_IDENTIFICATION=C
##
## attached base packages:
## [1] parallel methods stats graphics grDevices utils datasets
## [8] base
##
## other attached packages:
## [1] lubridate_1.7.4 jsonlite_1.6 ggplot2_3.2.1 DT_0.10
## [5] magrittr_1.5 rmarkdown_2.1 data.table_1.12.6
##
## loaded via a namespace (and not attached):
## [1] Rcpp_1.0.3 compiler_3.4.4 pillar_1.4.3 highr_0.8
## [5] tools_3.4.4 digest_0.6.22 evaluate_0.14 lifecycle_0.2.0
## [9] tibble_3.0.1 gtable_0.3.0 pkgconfig_2.0.3 rlang_0.4.5
## [13] yaml_2.2.0 xfun_0.11 withr_2.1.2 stringr_1.4.0
## [17] dplyr_0.8.3 knitr_1.26 htmlwidgets_1.5.1 vctrs_0.2.4
## [21] grid_3.4.4 tidyselect_0.2.5 glue_1.3.1 R6_2.4.1
## [25] purrr_0.3.3 scales_1.1.0 htmltools_0.4.0 ellipsis_0.3.0
## [29] assertthat_0.2.1 colorspace_1.4-1 stringi_1.4.3 lazyeval_0.2.2
## [33] munsell_0.5.0 crayon_1.3.4timeNeeded <- (proc.time()[3] - source.starting.time);../000.core/00.02.base.functions.R completed in 0.09 seconds
sourceTimeNeeded <- c( sourceTimeNeeded, timeNeeded)


source.starting.time <- proc.time()[3]
Load data
- Loading unique JSON ids.
uniqueFiles <- readRDS(file = getSourcePath("jobsOutput/jsonFilesToAnalyse.rds"))
filesToAnalyse <- uniqueFiles$jsonFile- Number of unique CVs: 392812.
timeNeeded <- (proc.time()[3] - source.starting.time);1.load.data.R completed in 3.07 seconds
sourceTimeNeeded <- c( sourceTimeNeeded, timeNeeded)


source.starting.time <- proc.time()[3]
Measuring Completion
The completion index is defined as,
completion Index = Number Of Key Fields X Ratio of CV completion
chunkRepo <- getSourcePath("jobsOutput/completionChunks/")
unlink(list.files(chunkRepo, full.names = TRUE))
json_files_split <- split(filesToAnalyse, 1:20)

fieldsMeasure <- c("SkillsPassport.Locale",
                   "SkillsPassport.LearnerInfo.Identification.ContactInfo.Address.Contact.Country.Code",
                   "SkillsPassport.LearnerInfo.Identification.Demographics.Birthdate.Year",
                   "SkillsPassport.LearnerInfo.Identification.Demographics.Gender.Code",
                   "SkillsPassport.LearnerInfo.Identification.Demographics.Nationality.Code",
                   "SkillsPassport.LearnerInfo.Identification.PersonName.FirstName",
                   "SkillsPassport.LearnerInfo.Identification.PersonName.Surname",
                   "SkillsPassport.LearnerInfo.Identification.ContactInfo.Email.Contact"
)

no_cores <- detectCores() - 1
cl <- makeCluster(no_cores, type = "FORK")
deafen <- parLapply(cl, json_files_split, function(json_chunk){

        json_DT <- lapply(json_chunk, function(x){
            jsonList <- fromJSON(x, flatten = TRUE)
            jsonVec <- unlist(jsonList, recursive = TRUE)
            completion <- sum(!is.na(jsonVec))/length(jsonVec)
            existFields <- names(jsonVec) %in% fieldsMeasure
            resultVec <- c(jsonVec[existFields], completion)
            result <- resultVec %>% data.table %>% transpose
            setnames(result, c(names(jsonVec[existFields]), "completion"))
        }) %>% rbindlist(fill = TRUE)
        #without locale check for NA
        columnsCheckNA <- which(names(json_DT) %in% fieldsMeasure[-1])
        for (j in columnsCheckNA) set(json_DT, j = j, value = !is.na(json_DT[[j]]))

        json_DT[, id := json_chunk]
        uniqueNum <- as.numeric(Sys.time())
        saveRDS(
            object = json_DT,
            file = paste0(chunkRepo, uniqueNum, ".rds")
        )

})
stopCluster(cl)

dataChunks <- list.files(path = chunkRepo, full.names = TRUE)
mergeChunksDT <- lapply(dataChunks, function(x){
  readRDS(x)
}) %>% rbindlist(fill = TRUE, use.names = TRUE)
mergeChunksDT[, numKPI := mergeChunksDT[, which(names(mergeChunksDT) %in% fieldsMeasure[-1]), with = FALSE] %>% rowSums]
mergeChunksDT[, completionIndex := numKPI*as.numeric(completion)]
Draft Boxplot
ggplot(mergeChunksDT, aes(x = factor(SkillsPassport.Locale), y = completionIndex)) +
    geom_boxplot() +
    xlab("CV locale") +
    ylab("Completion Index")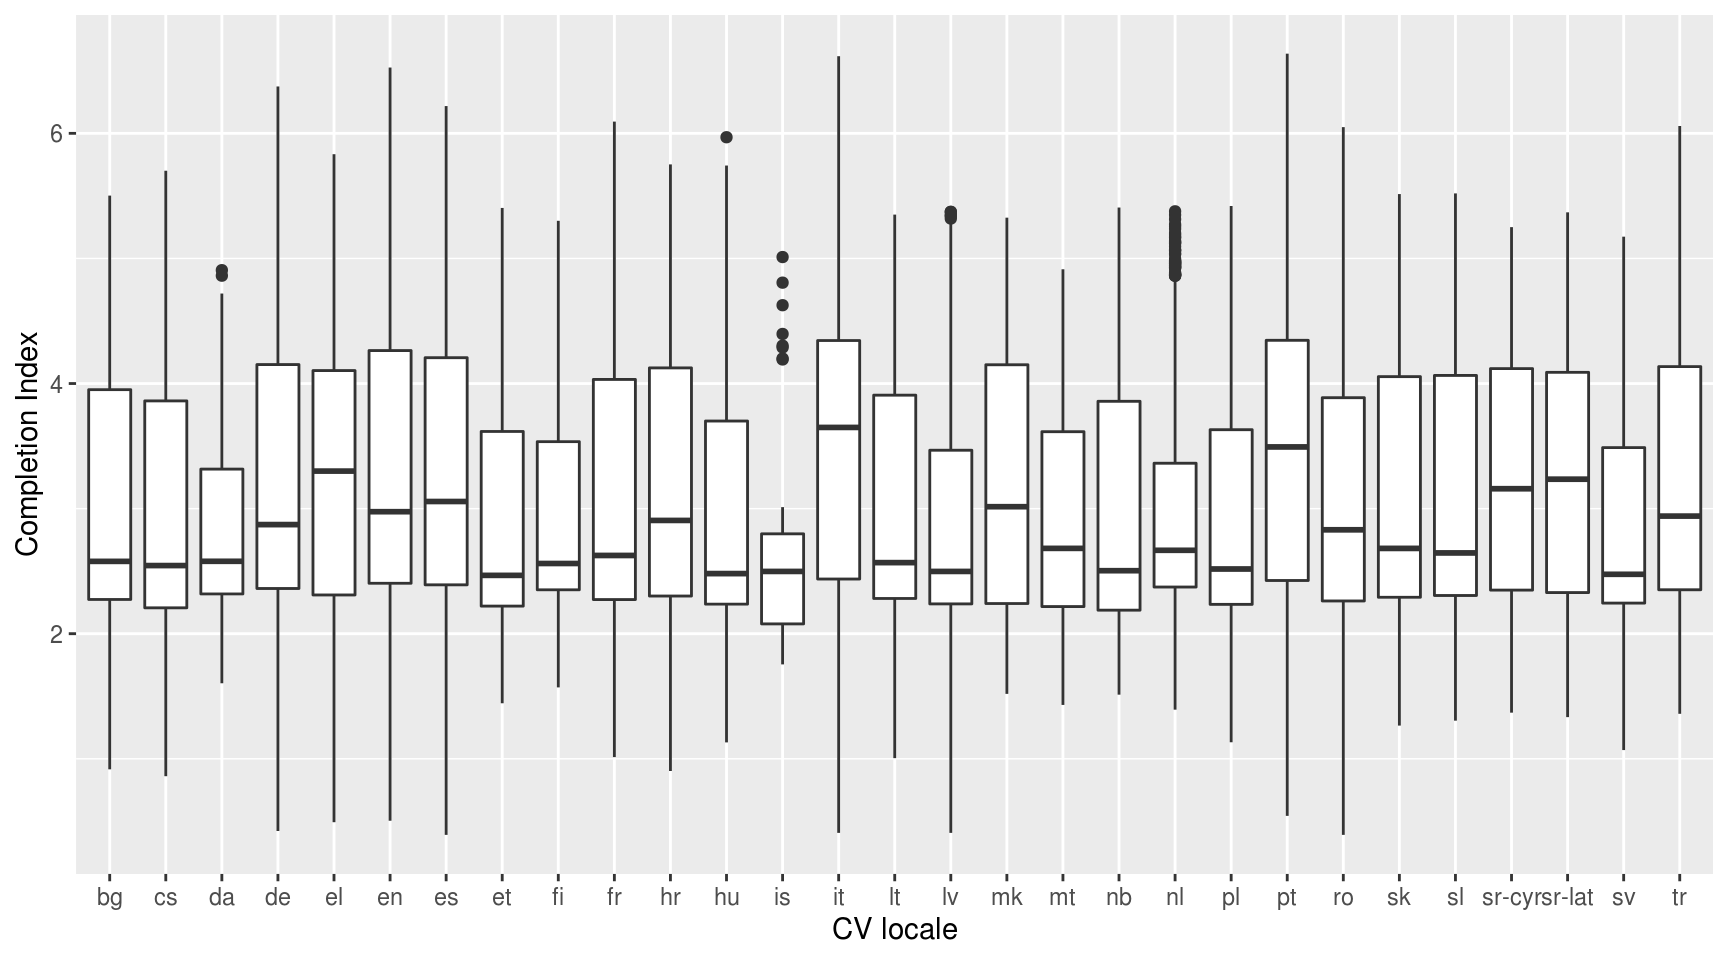
timeNeeded <- (proc.time()[3] - source.starting.time);2.process.data.R completed in 1805.6 seconds
sourceTimeNeeded <- c( sourceTimeNeeded, timeNeeded)


source.starting.time <- proc.time()[3]
Stratified sampling
Sampling CVs based on the completion index per strata. The strata are defined per CV locale and are collectively exhaustive and mutually exclusive. A proportionate allocation strategy is followed in each of the strata where the bottom 10% of the CVs is discarded.
strataData <- mergeChunksDT[order(SkillsPassport.Locale, -completionIndex)]
mergeChunksDT[, SkillsPassport.Locale := as.factor(SkillsPassport.Locale)]
strataData <- strataData[, head(.SD, .N*0.90), by = SkillsPassport.Locale]
discardedCVs <- mergeChunksDT[!(id %in% strataData$id)]
strataData[, id := cleanJsonId(id)]
summariseTable(strataData[, .(id, SkillsPassport.Locale, completionIndex)])
Summary of the discarded CVs.
summariseTable(discardedCVs)timeNeeded <- (proc.time()[3] - source.starting.time);3.process.data.R completed in 20.27 seconds
sourceTimeNeeded <- c( sourceTimeNeeded, timeNeeded)


source.starting.time <- proc.time()[3]
Save data
Save kept data.
fileName <- "jobsOutput/strataData.rds"
saveBinary(strataData$id, fileName)
Datasource : /data/generic/jobsOutput/strataData.rds of 9,727,980 bytes.
Save discarded CVs.
dir.create(file.path(getSourcePath("jobsOutput"), "discardedCVs"))
deafen <- file.copy(discardedCVs$id, paste0(getSourcePath("jobsOutput/"), "discardedCVs/"))
pathToZip <- "/data/tmpfs/results/discardedCVs.zip"
if(file.exists(pathToZip))
    unlink(pathToZip)
password <- read.table(paste0(getSourcePath("input/"), "discardedCVsPassword.txt"))$V1 %>% invisible
deafen <- zip(zipfile = pathToZip, files = paste0(getSourcePath("jobsOutput/"), "discardedCVs/"), flags = paste("-r9XjP", password))
unlink(file.path(getSourcePath("jobsOutput"), "discardedCVs"), recursive = T)
timeNeeded <- (proc.time()[3] - source.starting.time);4.save.data.R completed in 14.35 seconds
sourceTimeNeeded <- c( sourceTimeNeeded, timeNeeded)Computation metrics
source.blocks$sourceTimeNeeded <- sourceTimeNeeded;Computational report
Completed in 1844.6 seconds.
Subpart metrics
reportTabularData(source.blocks);